
Solution of Two Linear Equations- 8th Grade
Using the Integers 0-9 (without duplication), provide four sets of points that represent two distinct lines. These lines can be written as two linear equations. Then provide a fifth point that represents the intersection (or solution) of those equations.

Line 1: (__, __) and (__, __)
Line 2: (__, __) and (__, __)
Solution (__, __)
Write the equation of both lines.
Positive Correlation– 8th Grade
Create a table of 10 ordered pair that creates a positive correlation (that is not linear):
X:_________________________
Y
Is your correlation strong or weak? Explain how you know.
Give an example of what this data might represent.
Negative Correlation- 8th grade
Create a table of 10 ordered pair that creates a negative correlation (that is not linear):
X:_________________________
Y
Is your correlation strong or weak? Explain how you know.
Give an example of what this data might represent.
Functions- 8th Grade
Using the Integers 0-9 (and only each Integer once), create a set of ordered pair that represents a Function.
f(x) = ( , ),( , ),( , ),( , ),( , )
Graph the Ordered Pairs

Using the Rational Numbers 0-9 (and only each once), create a set of ordered pair that does not represents a Function.
( , ),( , ),( , ),( , )
Graph the Ordered Pairs
Comparing Functions- 8th Grade
Using the Integers 0-9 (and each integer only once), how many Linear Functions can you create that has a greater rate of change than the following graph:

f(x) = {( , ),( , ),( , ),( , ),( , )}
Slope of the graph =
Slope of my function =
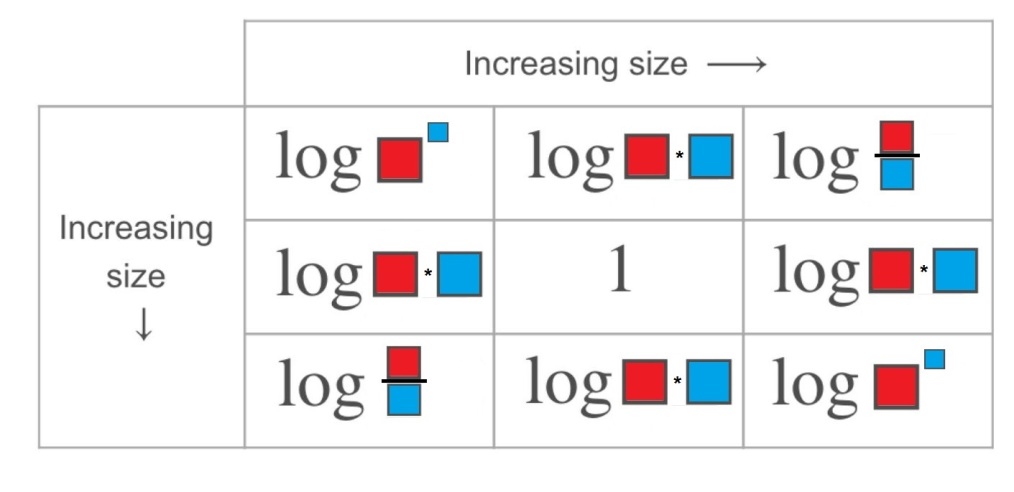
Logs- HS
Directions: Using the integers 1 to 9, fill in the red and blue boxes so that the chart is accurate. You can only use a number once per red box and once per blue box.

Thank you to Megan Schmidt, @veganmathbeagle, for introducing me to this graphic from underground mathematics.
Laws of Logs- HS
logs are in base 10.
Logs 2- HS
Directions: Using the integers 1 to 9 in the boxes, create a log that satisfies the follow constraints (you can use a number only once):

Trig Ratios- HS
Directions: Using the following trig ratios, complete the following table:
cos 30º, sin 30º, cos 45º, sin 45º, tan 30º, cot 30º, sec 30º, csc 30º

What trig ratios CANNOT go in the center square?
What is the smallest trig ratio that can be placed in the center square?
Matrix Multiplication- HS
Directions: Using the digits 1-9, each only once, fill in the blanks to create the smallest possible value for a.

How would you change your numbers to create the smallest value for b?
Create matrices such that a and b are of equal value (if you can’t generate equal values, how close can they get?)
