
Directions: Using the numbers 1-9, each only once, fill in the boxes to make the following product true.
How many possibilities are there?
Explain your thinking to find your answer.
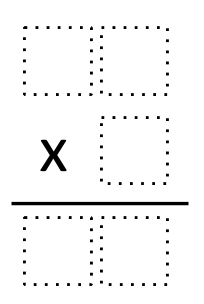
Directions: Using the numbers 1-9, each only once, fill in the boxes to make the following product true.
How many possibilities are there?
Explain your thinking to find your answer.
Nicora has a great post on multiplying fractions, check it out here. This is something similar that I end up reviewing with my 8th graders. She was wondering about what I have found so here it is….
I start with AREA, Chris(@trianglemancsd) may call it an array, whatever works. I started approaching multiplication this way since they are pounded with Area problems in 7th grade. The concept and procedure is ingrained and ready to be built upon.
I start with a multiplication problem I am pretty confident all of my students will know, such as 3×5. Students will quickly tell me it is 15. I ask how they can represent that math question and answer, and I get a variety of methods. I will get at least one student who shows me an area problem. I pick that example and we talk about area and what it means, how to represent it and I ask them to draw a diagram on graph paper showing it. This is what I get:

This is exactly what I want to see, even though I kinda manipulated the students into showing me a representation I want to build upon. I then ask them to show me representations of 3 and 5 using the graph paper grid, and then I create the following construction to connect to their previous representation of 3×5.

This is not a big stretch from what they already do and know, so I have them practice it a bit and come up with new problems in order to try and stump their friends or even me. Students try and get tricky, and at least one will introduce the idea of fractions into the mix. Once again, they are leading their learning where I would like them to go.

Students make the grid naturally like they did for 3×5. When asked why, I have had some who say “because we did it for the other problem.” A lot of mathematical thinking there, although some will pick up on it and say it is a representation of the area of 3×5. I will ask for other ideas, and students will tell me that the reason we have a grid of 15 is because it is the LCM of the denominators. Surprisingly, the shading of the grid has never been an issue with any of the students I have worked with. Typical student talk is “you can only shade on the first row, but only three of those.” When I ask why, students have said that it is the area model of 1×3. A few students will reply “because it’s a double grid Mr. Anderson, you have a grid of unshaded squares and a grid of shaded squares.” Some students have even suggested that I separate the drawings of shaded and unshaded squares- creating area models of the numerator and denominator. This really relates to the old rule of “multiply numerators and multiply denominators”, and students made that connection on their own.
The thing that I have to be careful of with this is that they use two fractions that are less than one. As long as they do, this works out very well for them. Students do try to do things like 3x(1/5) and get confused on the outcome, which would also look like 3/15 or 1/5. When I have student discussion about this, I always have one student who brings up that they can change the representation of 3 to 3/1. They then draw their separate area models for the numerator and denominator to find their answer of 3/5.
ACT 1:
Recently I had to go to a conference and when I walked in, this is what I saw

What questions do you have when you look at this picture?
Ask students to write down their questions, I normally ask students to find at least 3. When I observe that most students have questions written, I ask them to share those questions with their neighbor. I then throw up a Microsoft Word document and start typing down questions students supply. Students from my classroom came up with all sorts of different questions, some we can easily answer and others that we can’t. I am looking for a key question or questions to start this lesson. If students do not ask one of these questions, I tell them that I hope I can answer most of the questions provided, but that I need them to consider one of these questions first.
Any of these type of questions will lead students down the inquiry I hope to explore with them.
There are 512 attendees at this conference, how many tables are needed to seat them all?
How would this change if I needed to seat 900 attendees?
ACT 2:
Linear Equations is the topic I wish to address with my students. Students will need to think of counting strategies needed to determine the number of people at the conference. There are many different combinations of ways to figure this number out, but here are the stats:
There are 8 people seated at the head table, but they needed to use 6 tables (extra space was used for the podiums). Otherwise there are 4 sections of tables, 9 rows of tables to a section, 14 people to a row, and the table size is 6′.
These are hard to identify by the picture so the students really work on the following pieces of information: 6′ tables, 9 rows and 512 attendees.
I also ask students to create an equation for the number of tables that are needed.
ACT 3:
For comfort reasons, 2 people are seated per table.
You will need 7 tables per row.
4 x 9 x 7+ 6 = 258 tables.
Students will typically write this type of equation based on attendees:
512 = 2x + 8
504 = 2x
252 = x
Then I typically ask them how many tables per row, and what type of configurations makes sense for the conference (does one LONG row really work?).
Extensions:
After we decide the general equation for the conference, I then ask the students how many tables are needed for varying amounts of attendees: 200, 900, 1200, 2500. What type of configurations would work for these new conventions?
